System Biosciences
Mouse LncRNA Profiler qPCR Array Kit (cDNA synthesis kit and qPCR array) 20 profiles
- SKU:
- RA930A-1
- Availability:
- Usually Shipped in 5 Working Days
- Size:
- 20 profiles
- Shipping Temperature:
- Blue Ice/ Dry Ice
Description
Mouse LncRNA Profiler qPCR Array Kit (cDNA synthesis kit and qPCR array) 20 profiles . Cat# RA930A. Supplier: SBI System Biosciences

Overview
Profile 90 mouse lncRNAs with this kit that includes reagents for converting lncRNAs to cDNAs and a primer set for qPCR assays in a 96-well format. Get robust cDNA yields and clean, sensitive qPCR quantitation with undetectable background.
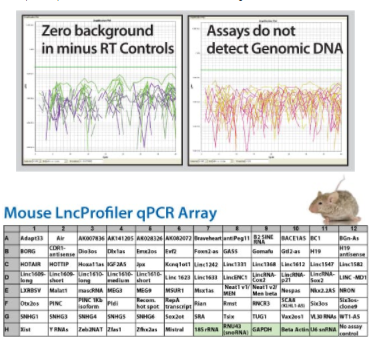
The kit includes five positive housekeeping reference controls and one negative control. In addition, the kit supports subcellular localization studies through RNA reference controls for the nucleolus, nucleus, and cytoplasm:
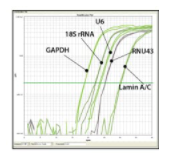
- Nucleolus—snoRNA RNU43 (and some 18S rRNA)
- Nucleus—small Nuclear splicing snRNA U6B
- Cytoplasm—GAPDH, Lamin A/C (Human Array) and Beta Actin (Mouse Array) as well as 18S rRNA
How It Works
Using the LncRNA Profiler qPCR Array Kit
First, get your lncRNA ready for qPCR by converting to cDNA
While some lncRNAs have endogenouse polyA tails, other lncRNAs do not. To enhance qPCR assay performance, the cDNA synthesis workflow includes steps and reagents to polyadenylate all lncRNAs before cDNA conversion using the tagged oligo dT adaptor and random primers. This combined RNA tailing and oligo dT plus random primers boosts cDNA yield significantly and enables strand-specific lncRNA qPCR profiling.
- Tag all lncRNAs with a poly-A tail
- Anneal an oligo-dT adaptor
- Reverse transcribe to create first-strand cDNA
The result is a cDNA pool of anchor-tailed lncRNAs that are ready for qPCR.
Then conduct qPCR assays
Get additional information about the array including lncRNA sequences, LncRNA database links, and qPCR analysis templates in the Excel document, “Assay List and Free Analysis Software for Mouse LncProfiler qPCR Array ”
Supporting Data
Example LncRNA Profiler qPCR Array Kit (Mouse) Data
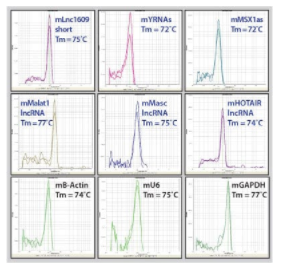
Figure 1. Sample dissociation analysis curves.
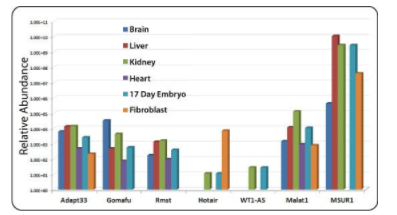
Figure 2. Profiling Mouse lncRNA expression profiles across various tissues.


